Ascombe’s Quartet
==2024-12-24=!=
Something rare and beautiful!
Theory
| I (x) | I (y) | II (x) | II (y) | III (x) | III (y) | IV (x) | IV (y) | |
|---|---|---|---|---|---|---|---|---|
| 1 | 10.0 | 8.04 | 10.0 | 9.14 | 10.0 | 7.46 | 8.0 | 6.58 |
| 2 | 8.0 | 6.95 | 8.0 | 8.14 | 8.0 | 6.77 | 8.0 | 5.76 |
| 3 | 13.0 | 7.58 | 8.0 | 8.74 | 13.0 | 12.74 | 8.0 | 8.84 |
| 4 | 9.0 | 8.81 | 8.0 | 8.77 | 9.0 | 7.11 | 8.0 | 8.47 |
| 5 | 11.0 | 8.33 | 11.0 | 9.26 | 11.0 | 7.81 | 8.0 | 7.04 |
| 6 | 14.0 | 9.96 | 14.0 | 8.10 | 14.0 | 8.84 | 8.0 | 5.25 |
| 7 | 6.0 | 7.24 | 6.0 | 6.13 | 6.0 | 6.08 | 19.0 | 12.50 |
| 8 | 4.0 | 4.26 | 4.0 | 3.10 | 4.0 | 5.39 | 8.0 | 5.56 |
| 9 | 12.0 | 10.84 | 12.0 | 9.13 | 12.0 | 8.15 | 8.0 | 7.91 |
| 10 | 7.0 | 4.82 | 7.0 | 7.26 | 7.0 | 6.42 | 8.0 | 6.89 |
| 11 | 5.0 | 5.68 | 5.0 | 4.74 | 5.0 | 5.73 | 8.0 | 8.69 |
| Mean | 9.0 | 7.5 | 9.0 | 7.5 | 9.0 | 7.5 | 9.0 | 7.5 |
| Var | 10.0 | 3.75 | 10.0 | 3.75 | 10.0 | 3.75 | 10.0 | 3.75 |
| Corr | 0.816 | 0.816 | 0.816 | 0.816 |
All four data sets have exactly the same mean, variance, correlation, and regression line.
But the visualizations suggest the four are different dataset:
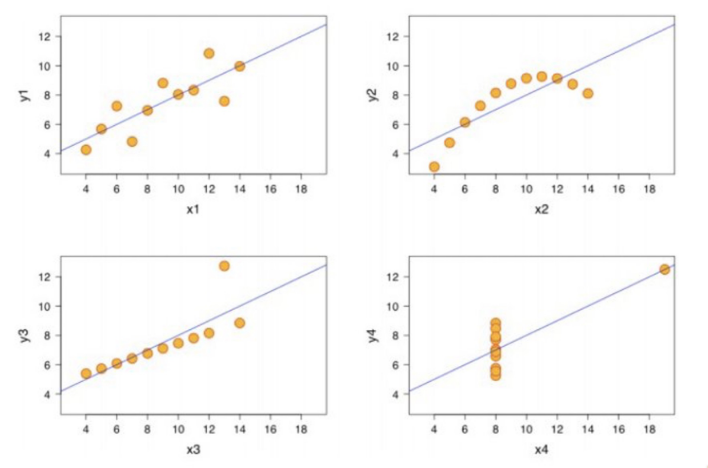
This is a perfect display of Advantages of Data Visualization.